2008 U.S. Elections
From 2007 to 2009, Carrie directed a team of more than 10 programmers, editors and graphic artists in generating hundreds of election-related maps, charts and explainers for the Associated Press.
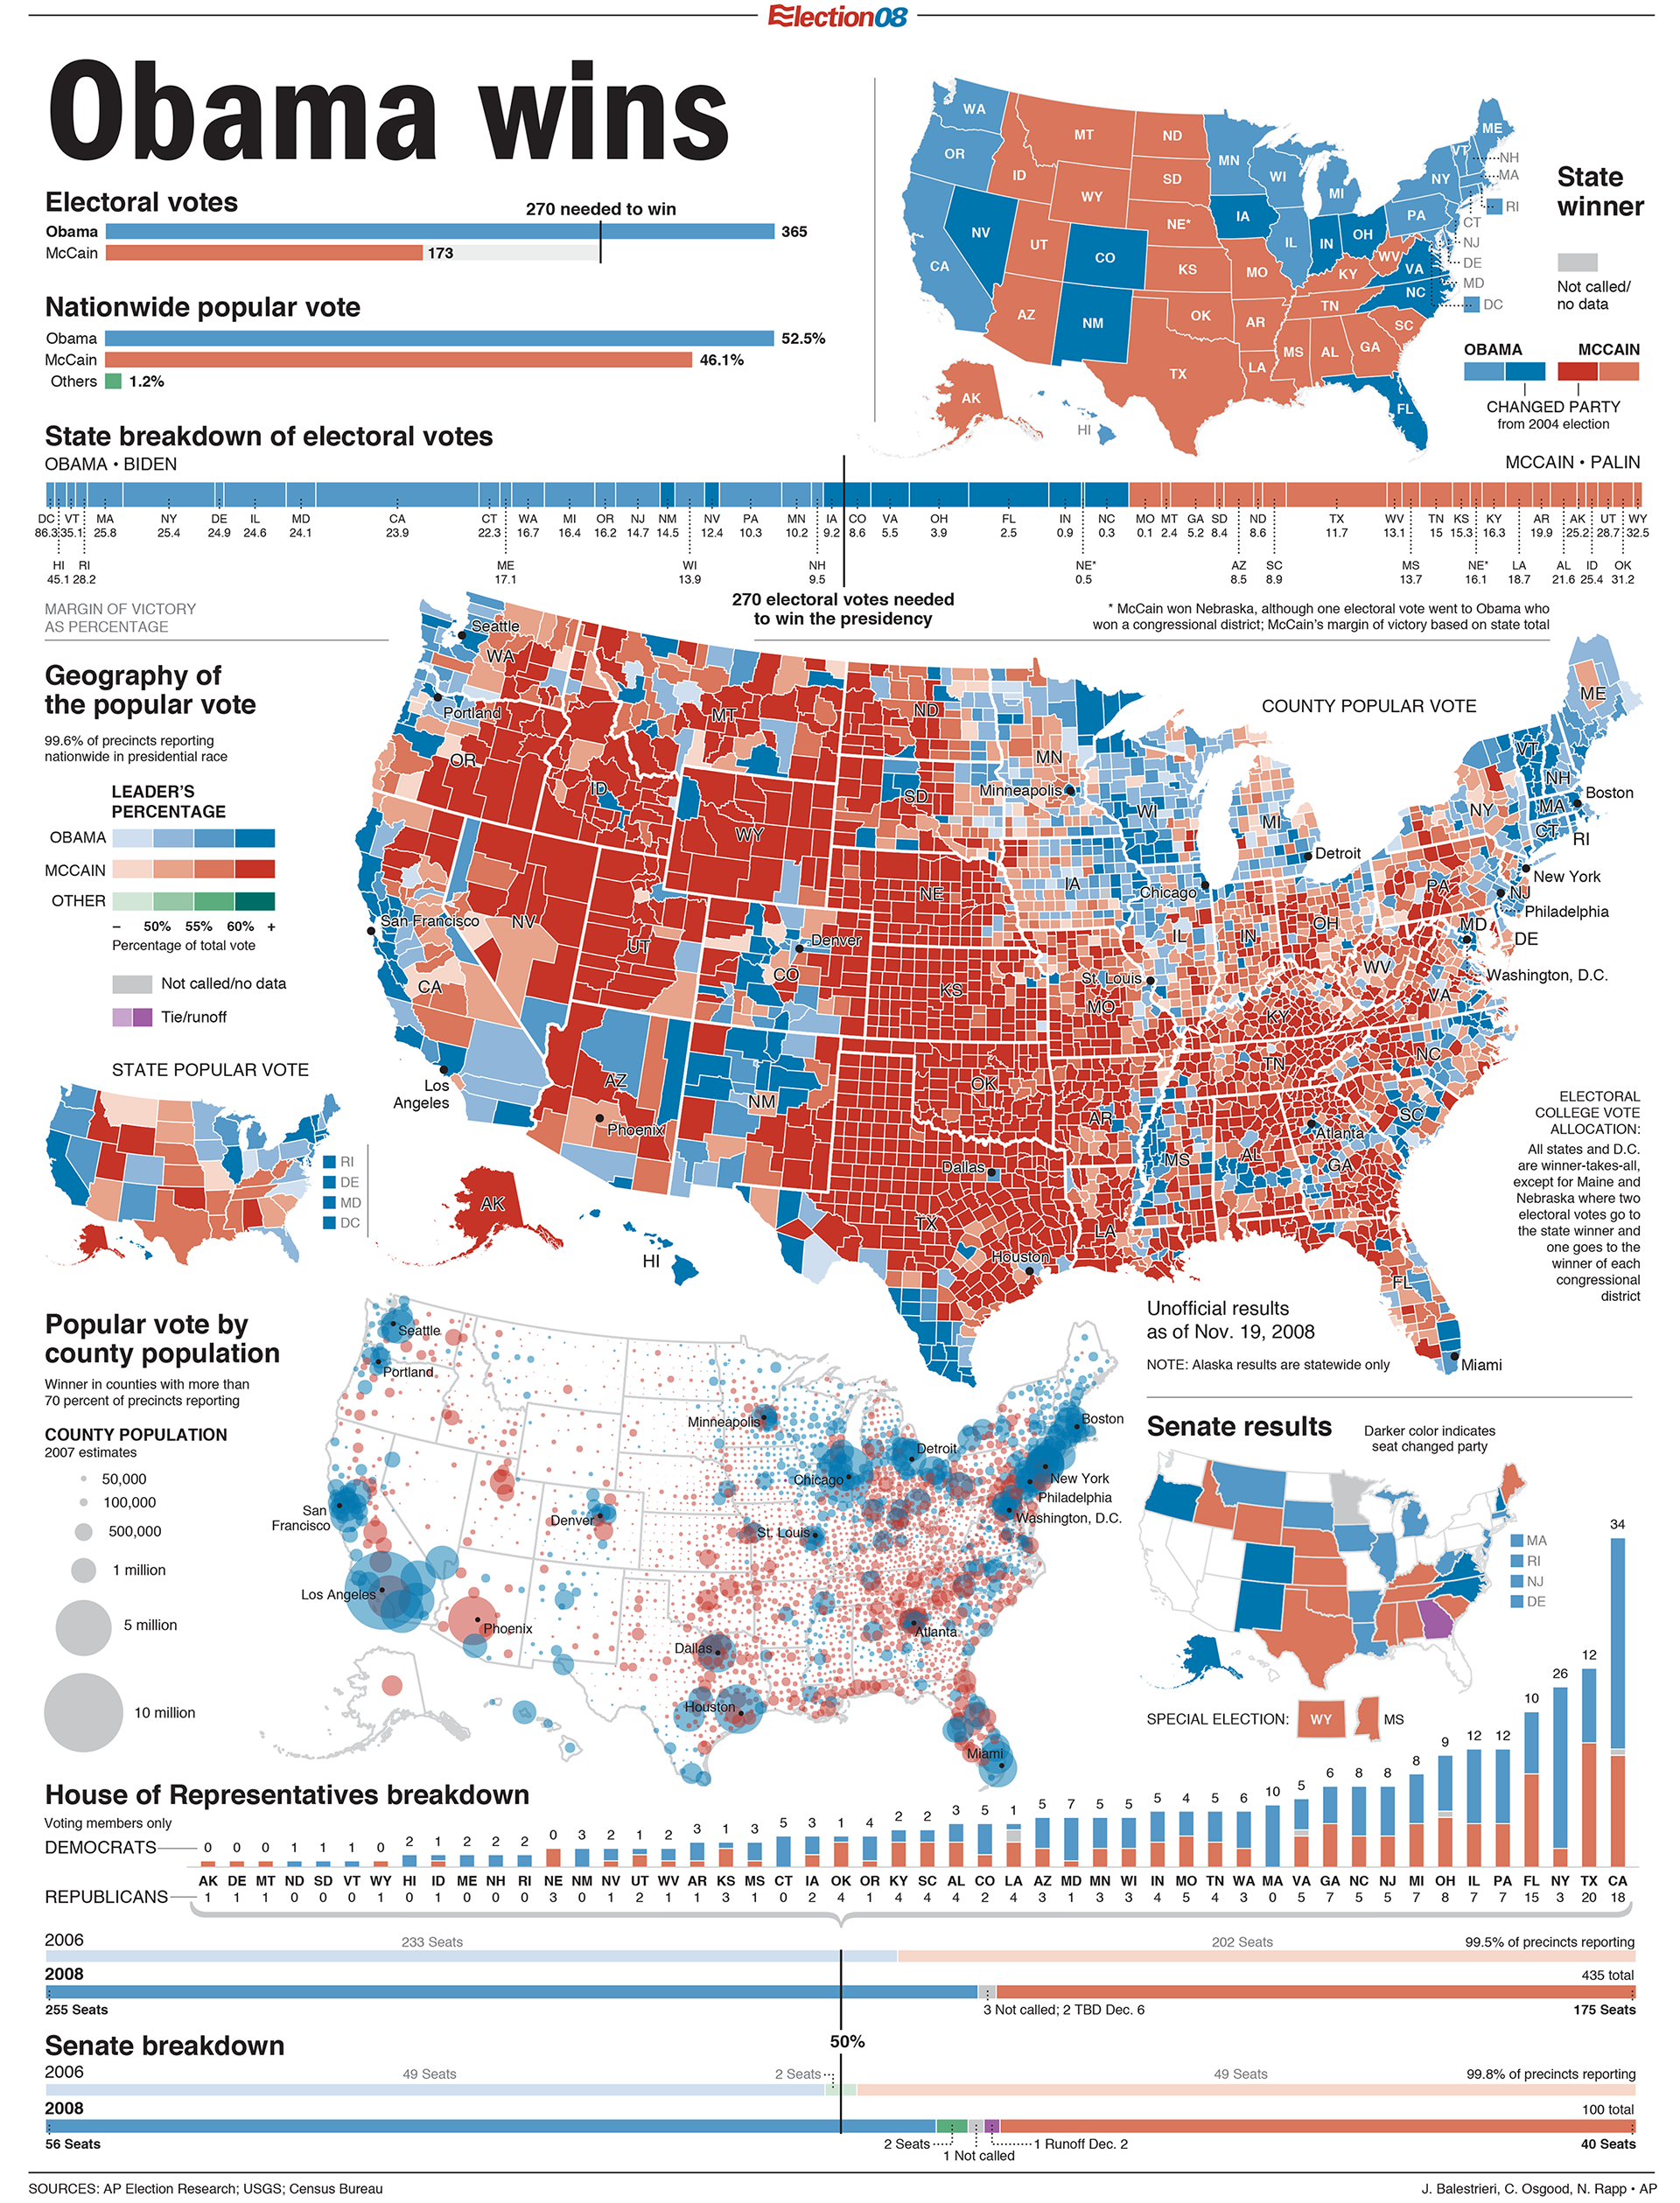
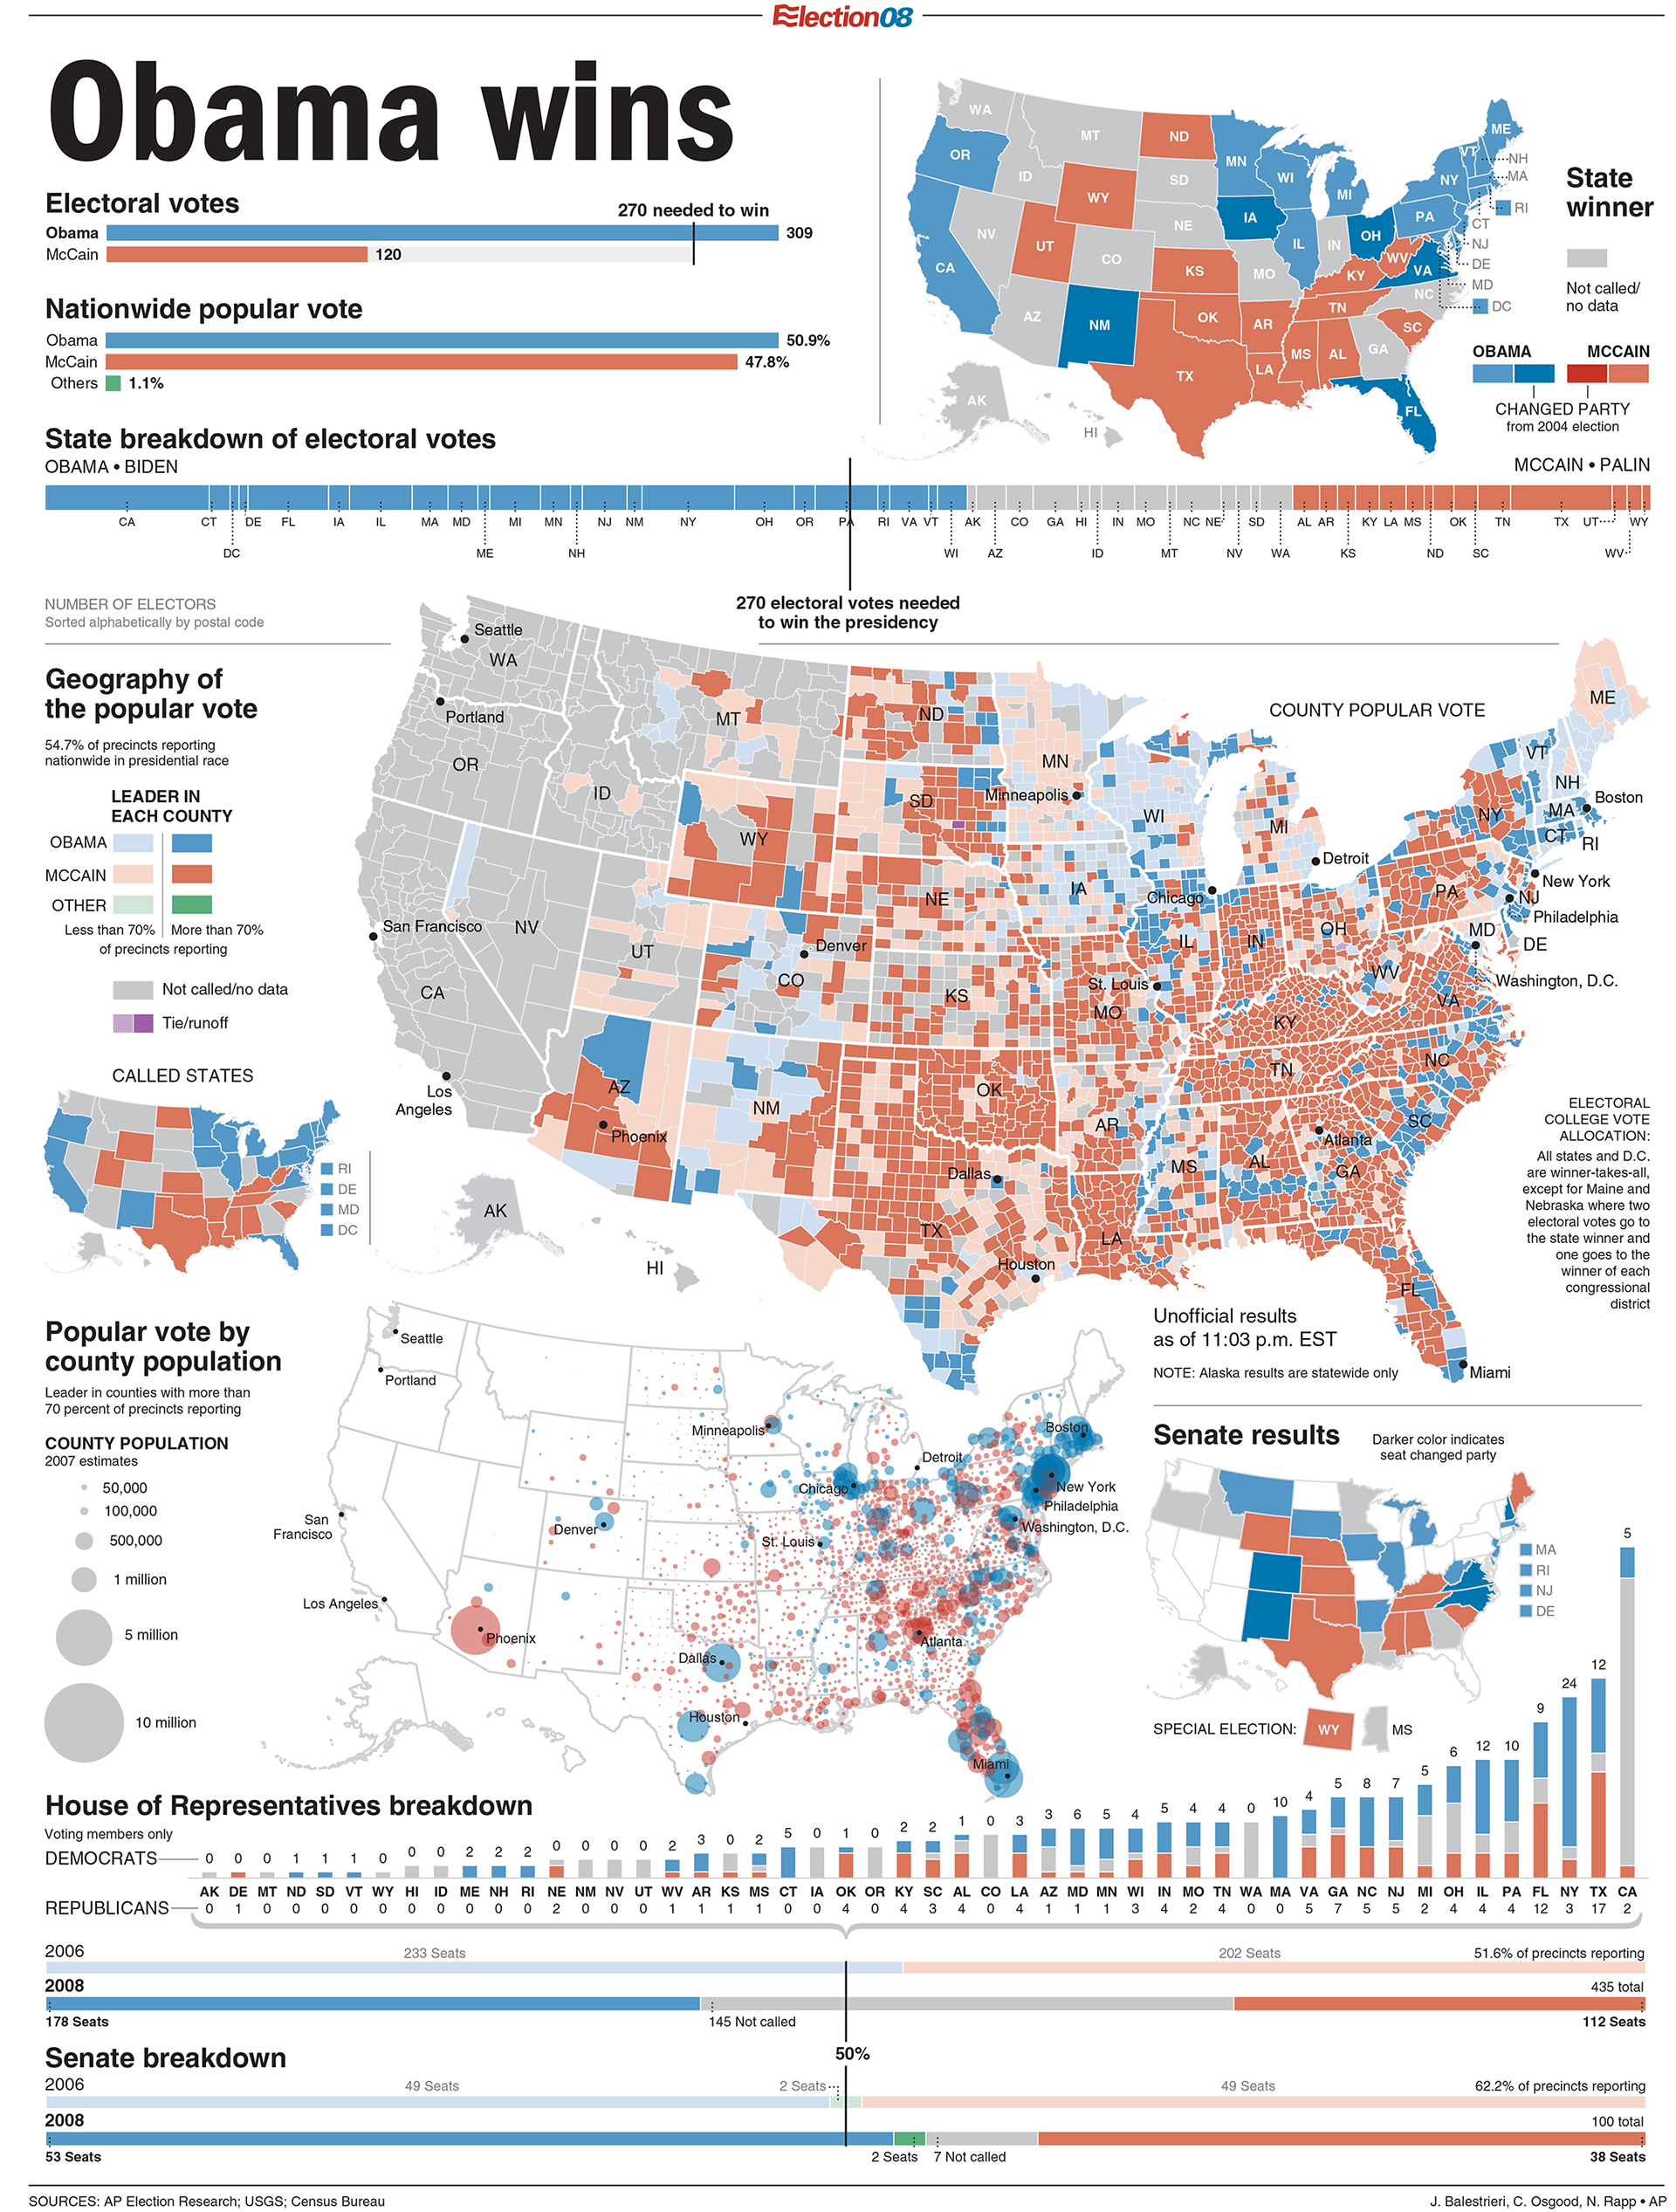
For Election Night 2008, she partnered with a developer in orchestrating a system that automatically generated detailed, accurate, visualized results for all 50 states. More than 400 graphics were published within 12 hours to meet the numerous deadlines for newspaper clients.
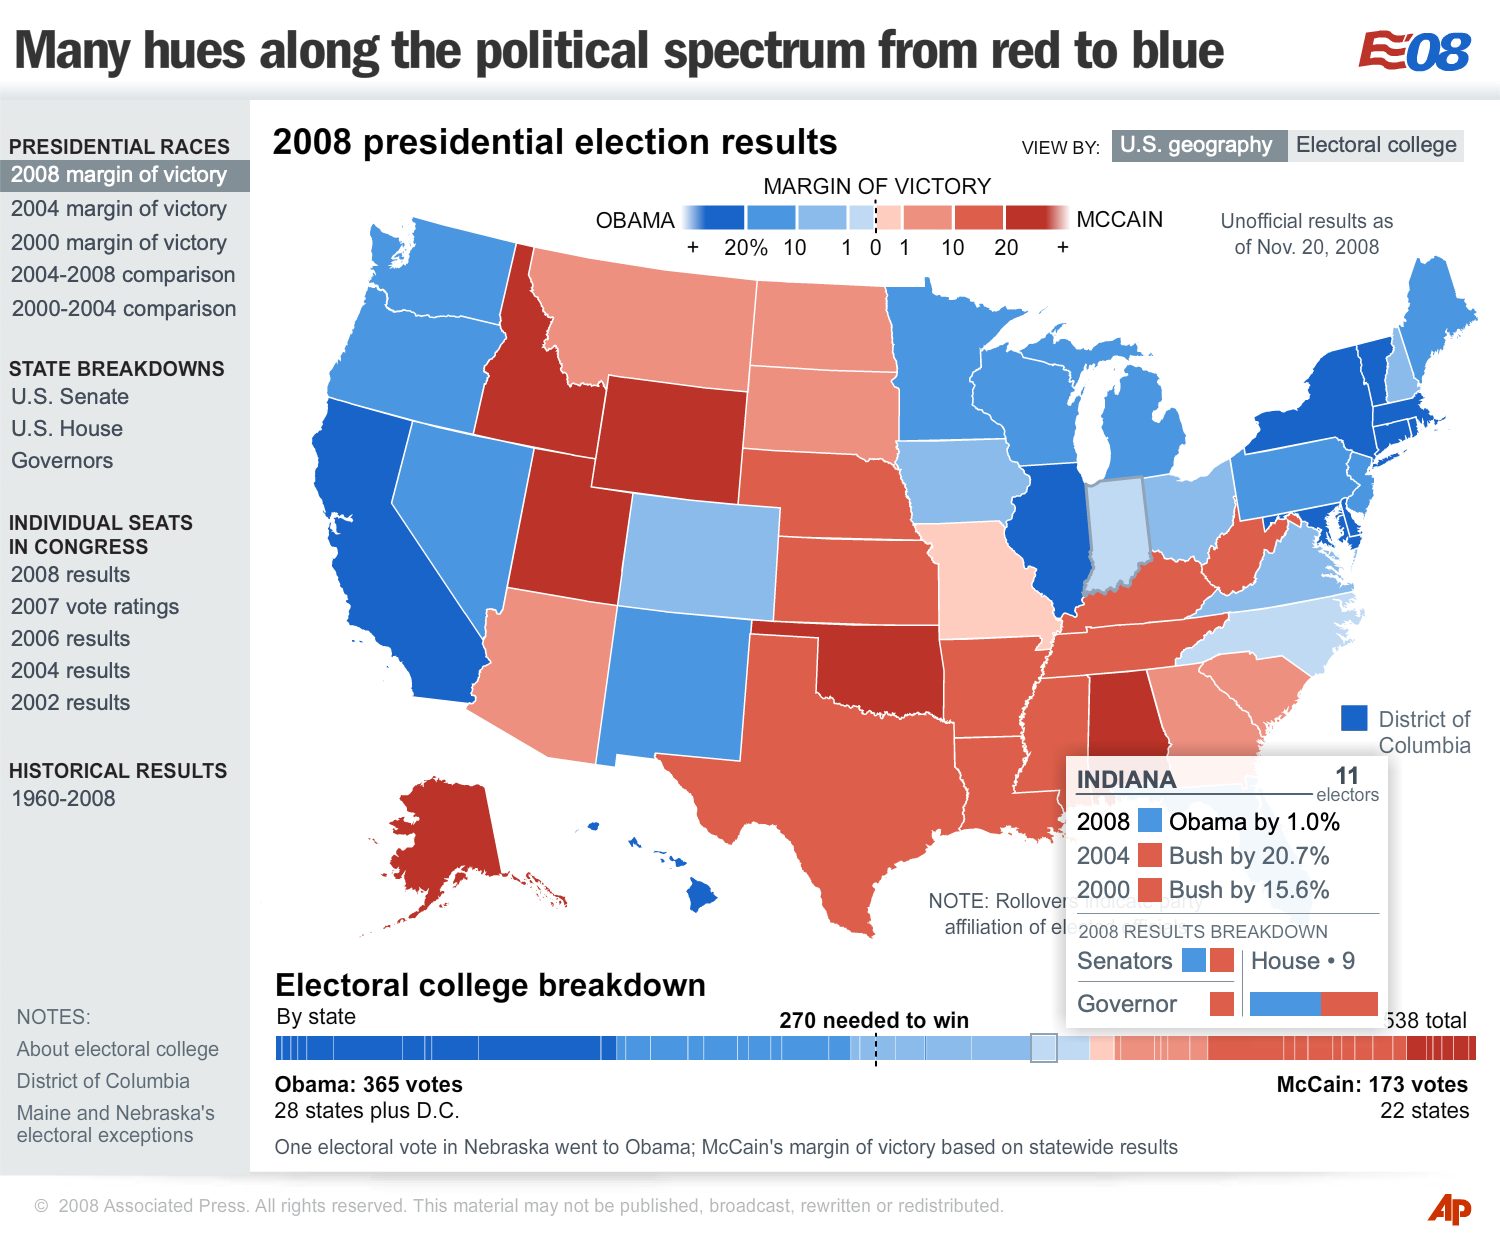
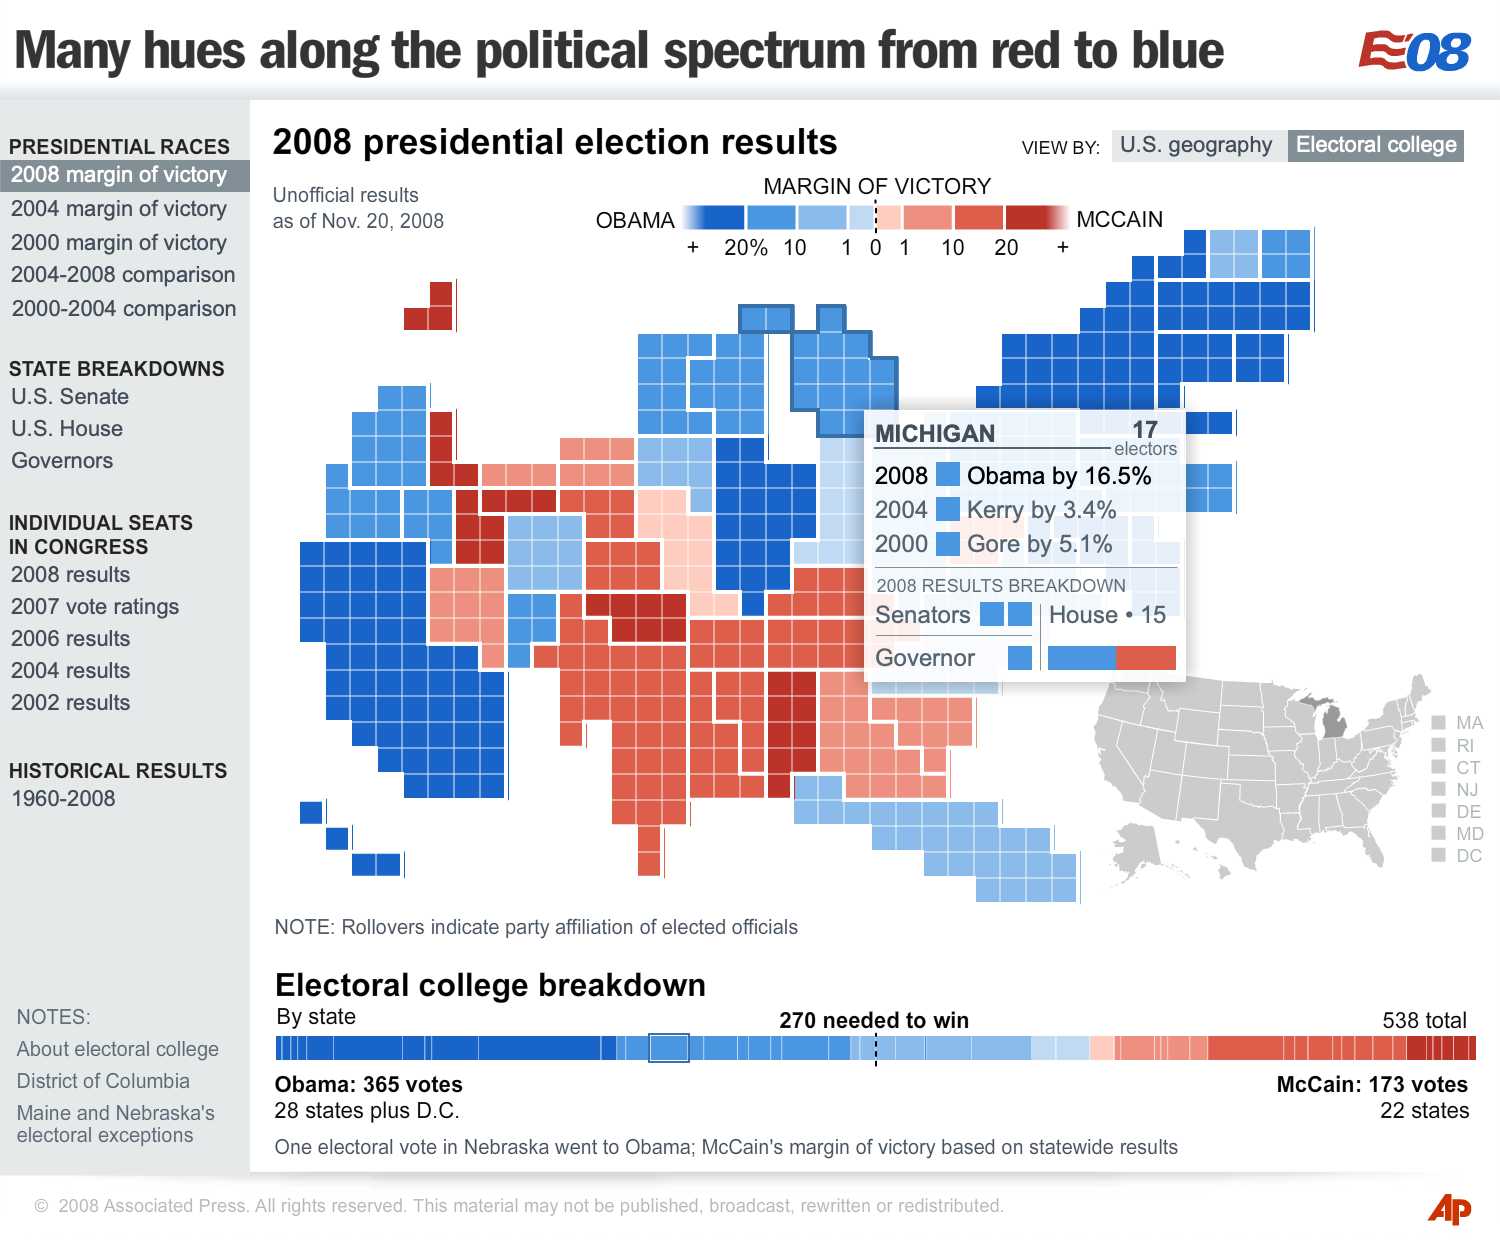
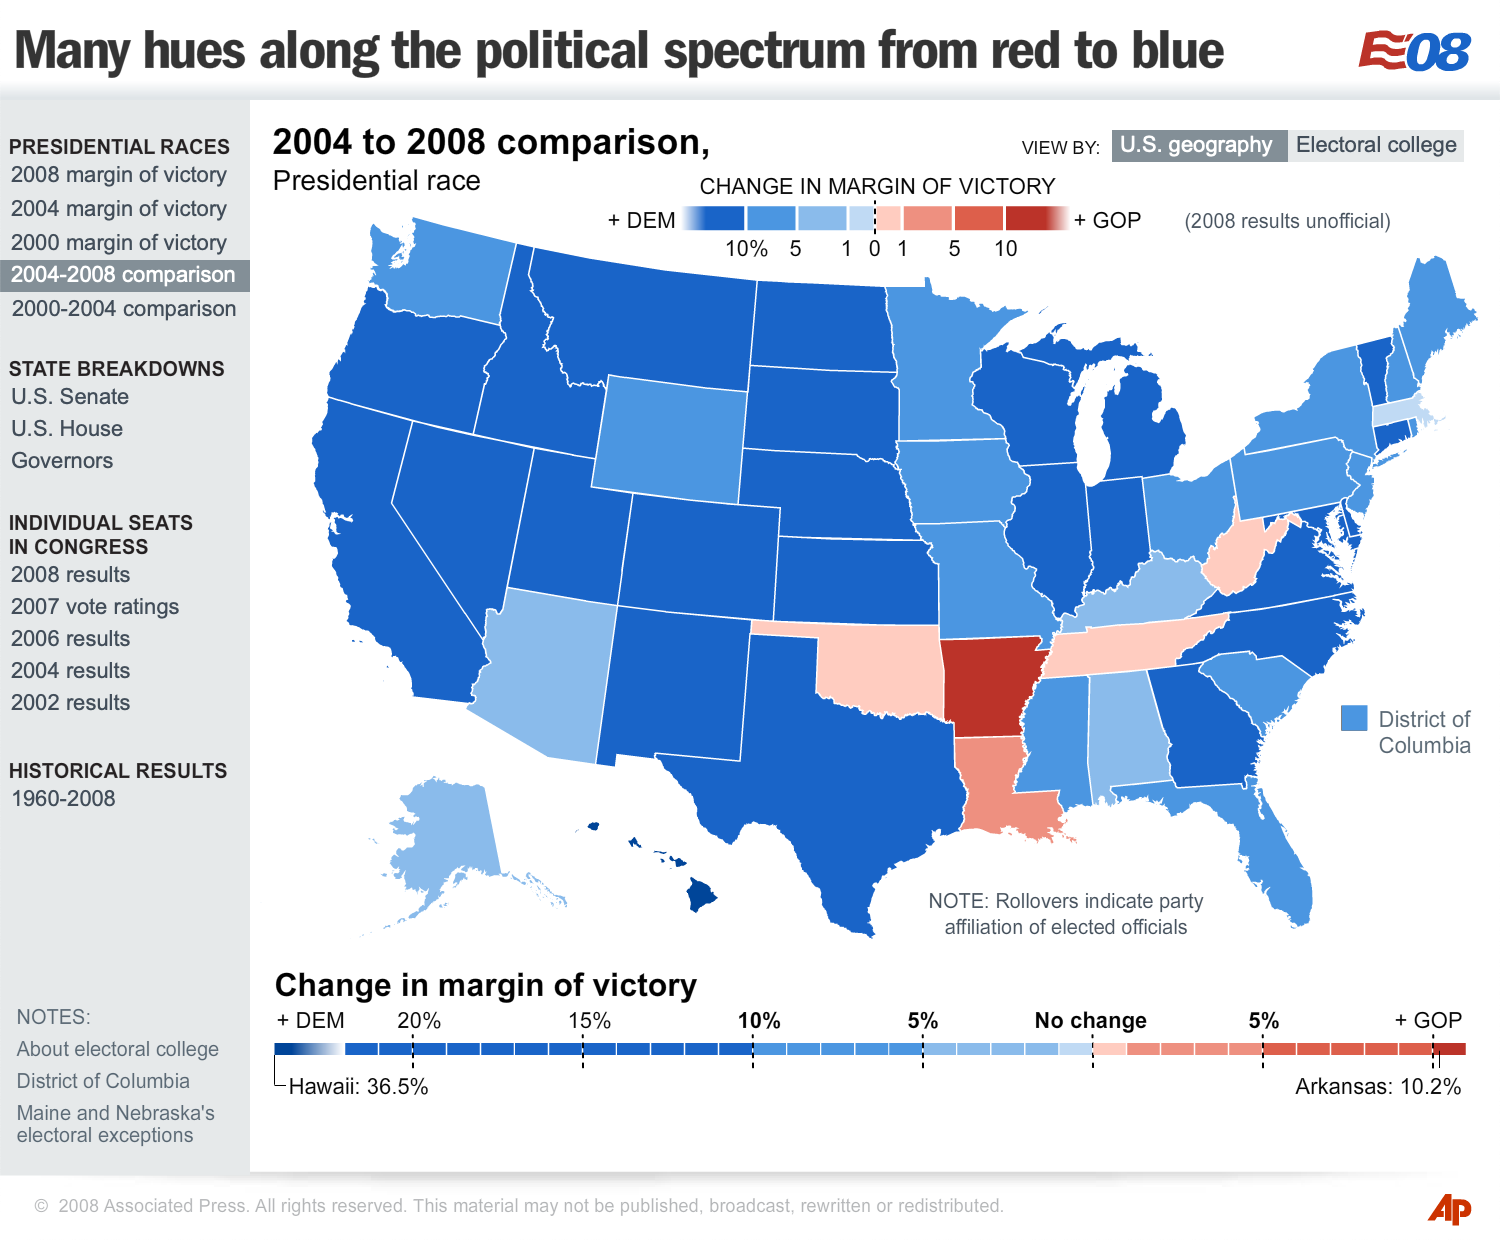
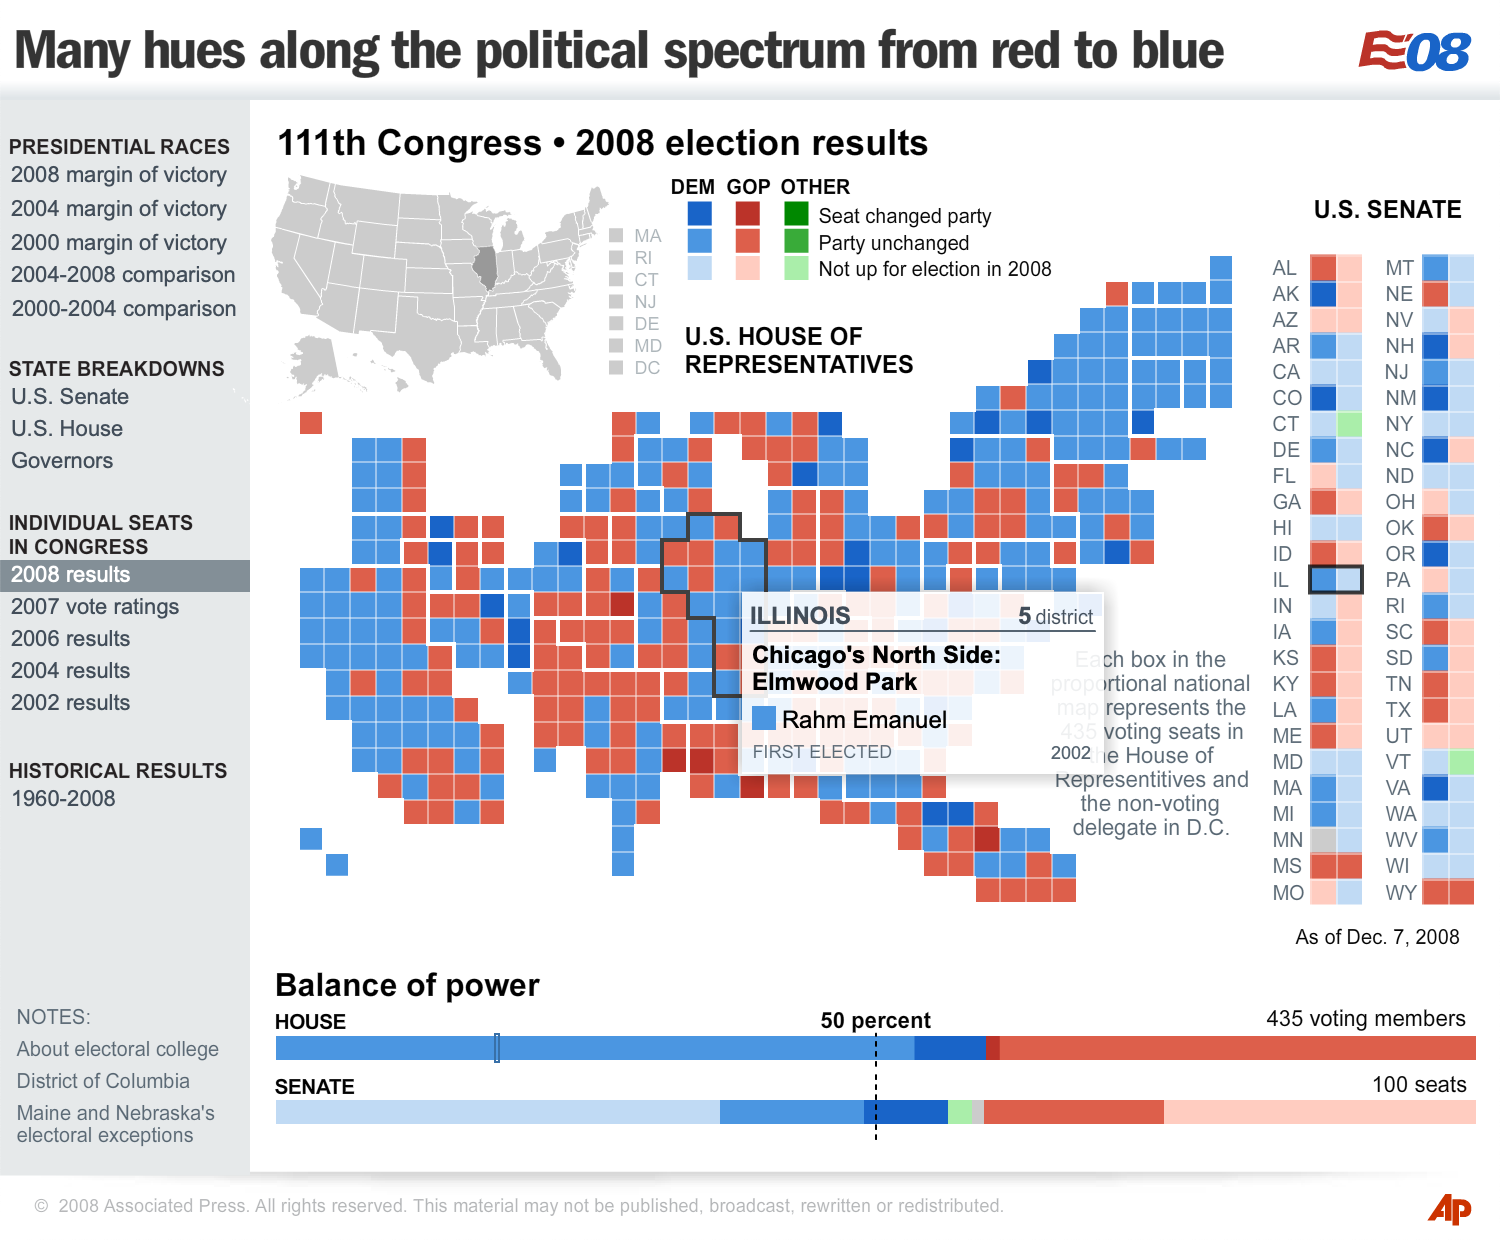
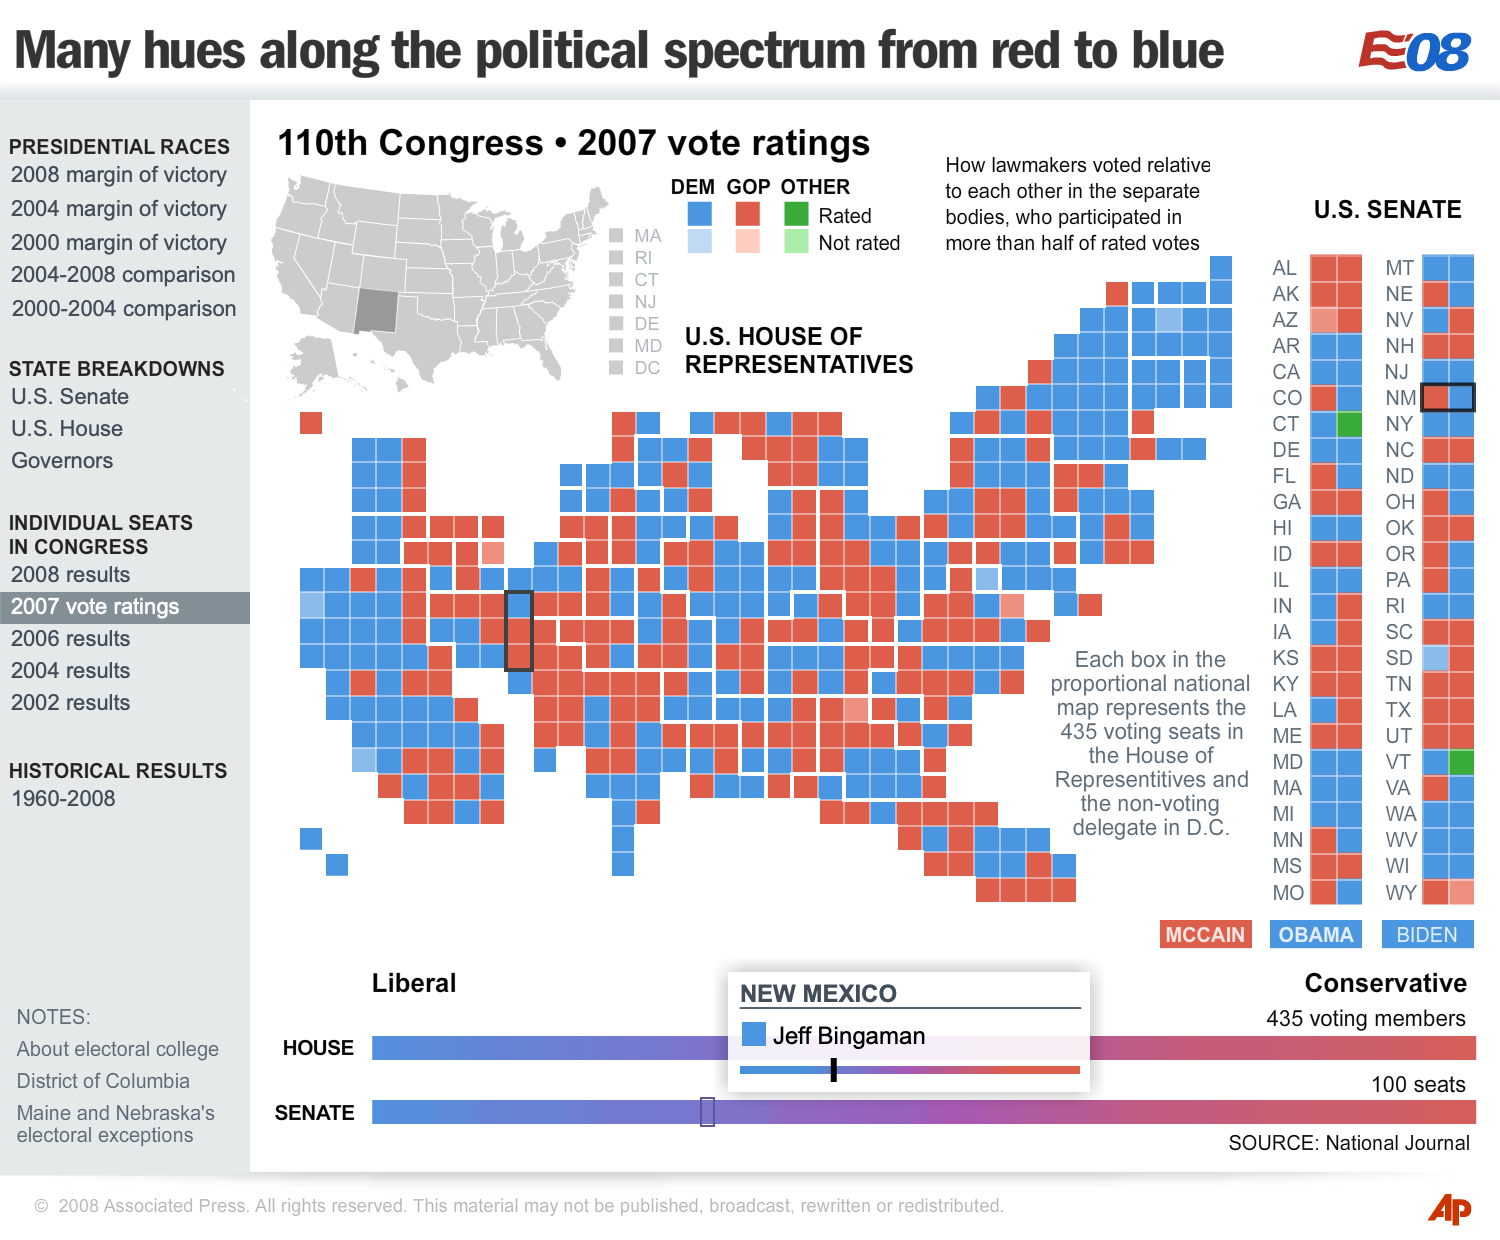
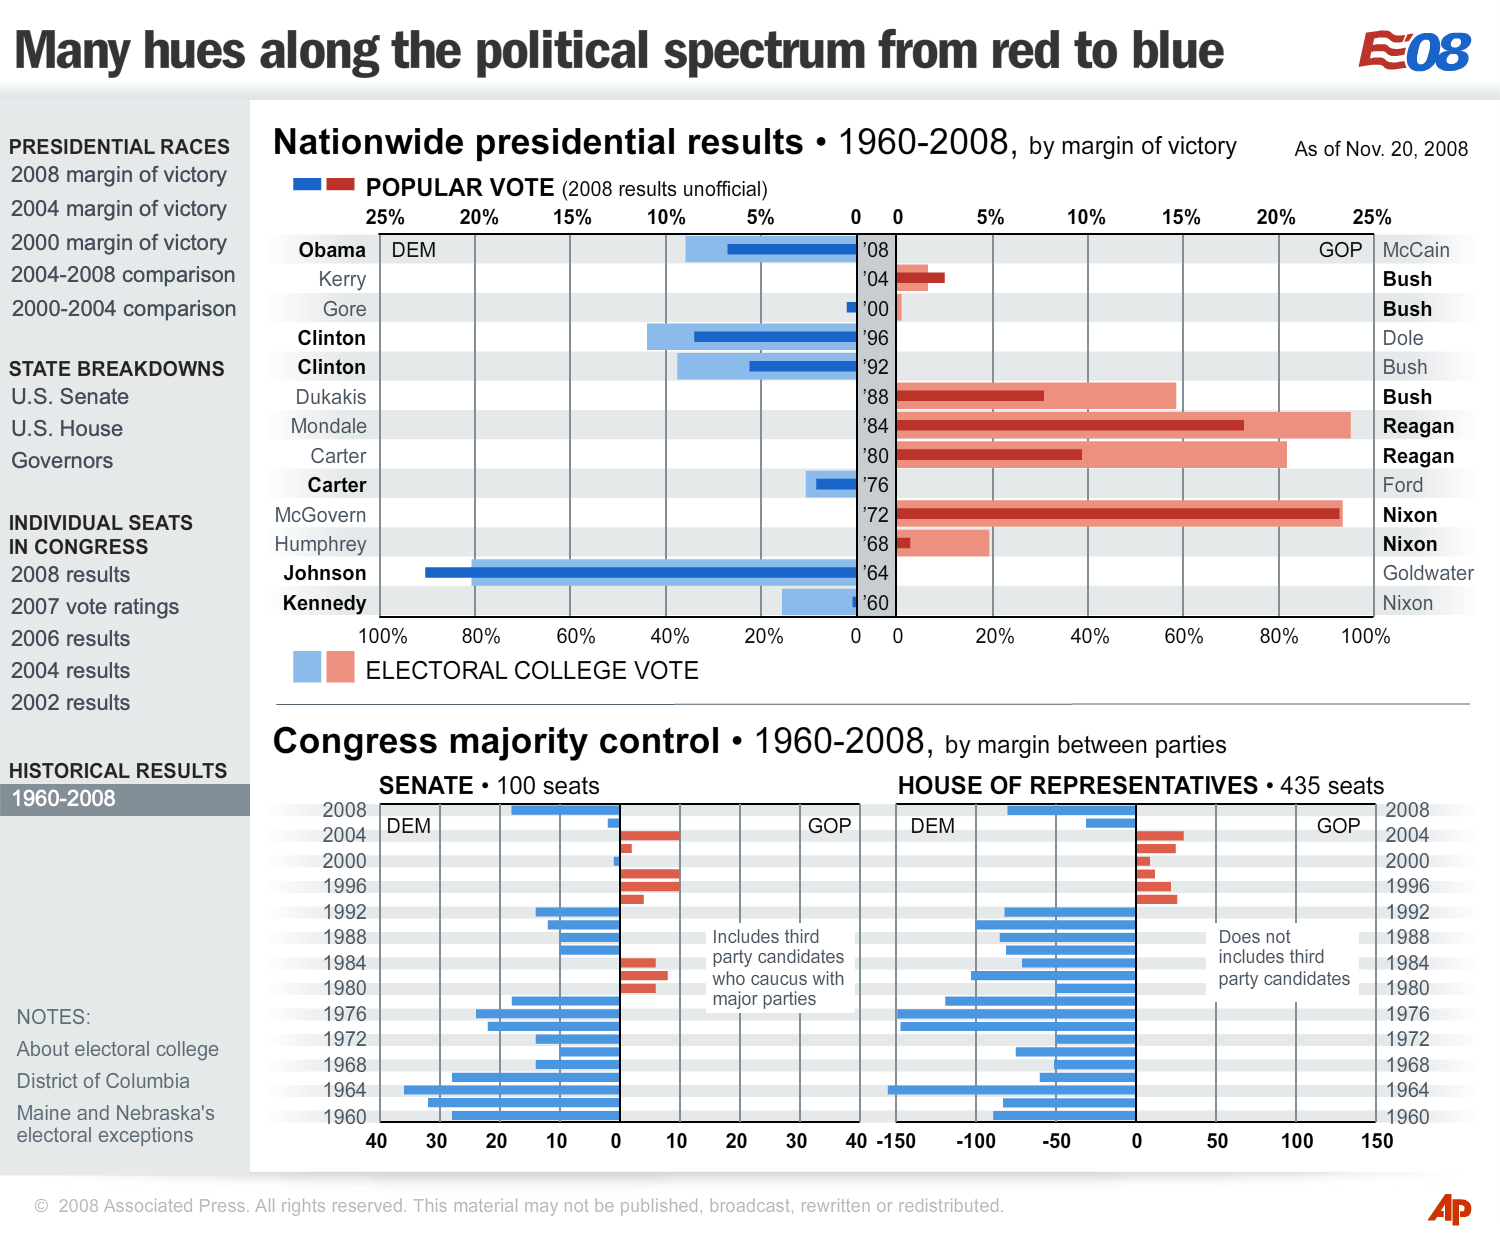
One project that she conceived and produced in collaboration with a Flash developer is the following interactive that explores the spectrum between the "red" and "blue" states. It examines the current and previous presidential, congressional and gubernatorial election results, as well as voting trends for members of the House and Senate.
For Election Night 2008, she partnered with a developer in orchestrating a system that automatically generated detailed, accurate, visualized results for all 50 states. More than 400 graphics were published within 12 hours to meet the numerous deadlines for newspaper clients.
One project that she conceived and produced in collaboration with a Flash developer is the following interactive that explores the spectrum between the "red" and "blue" states. It examines the current and previous presidential, congressional and gubernatorial election results, as well as voting trends for members of the House and Senate.
View series of graphics designed for newspapers (pdf):
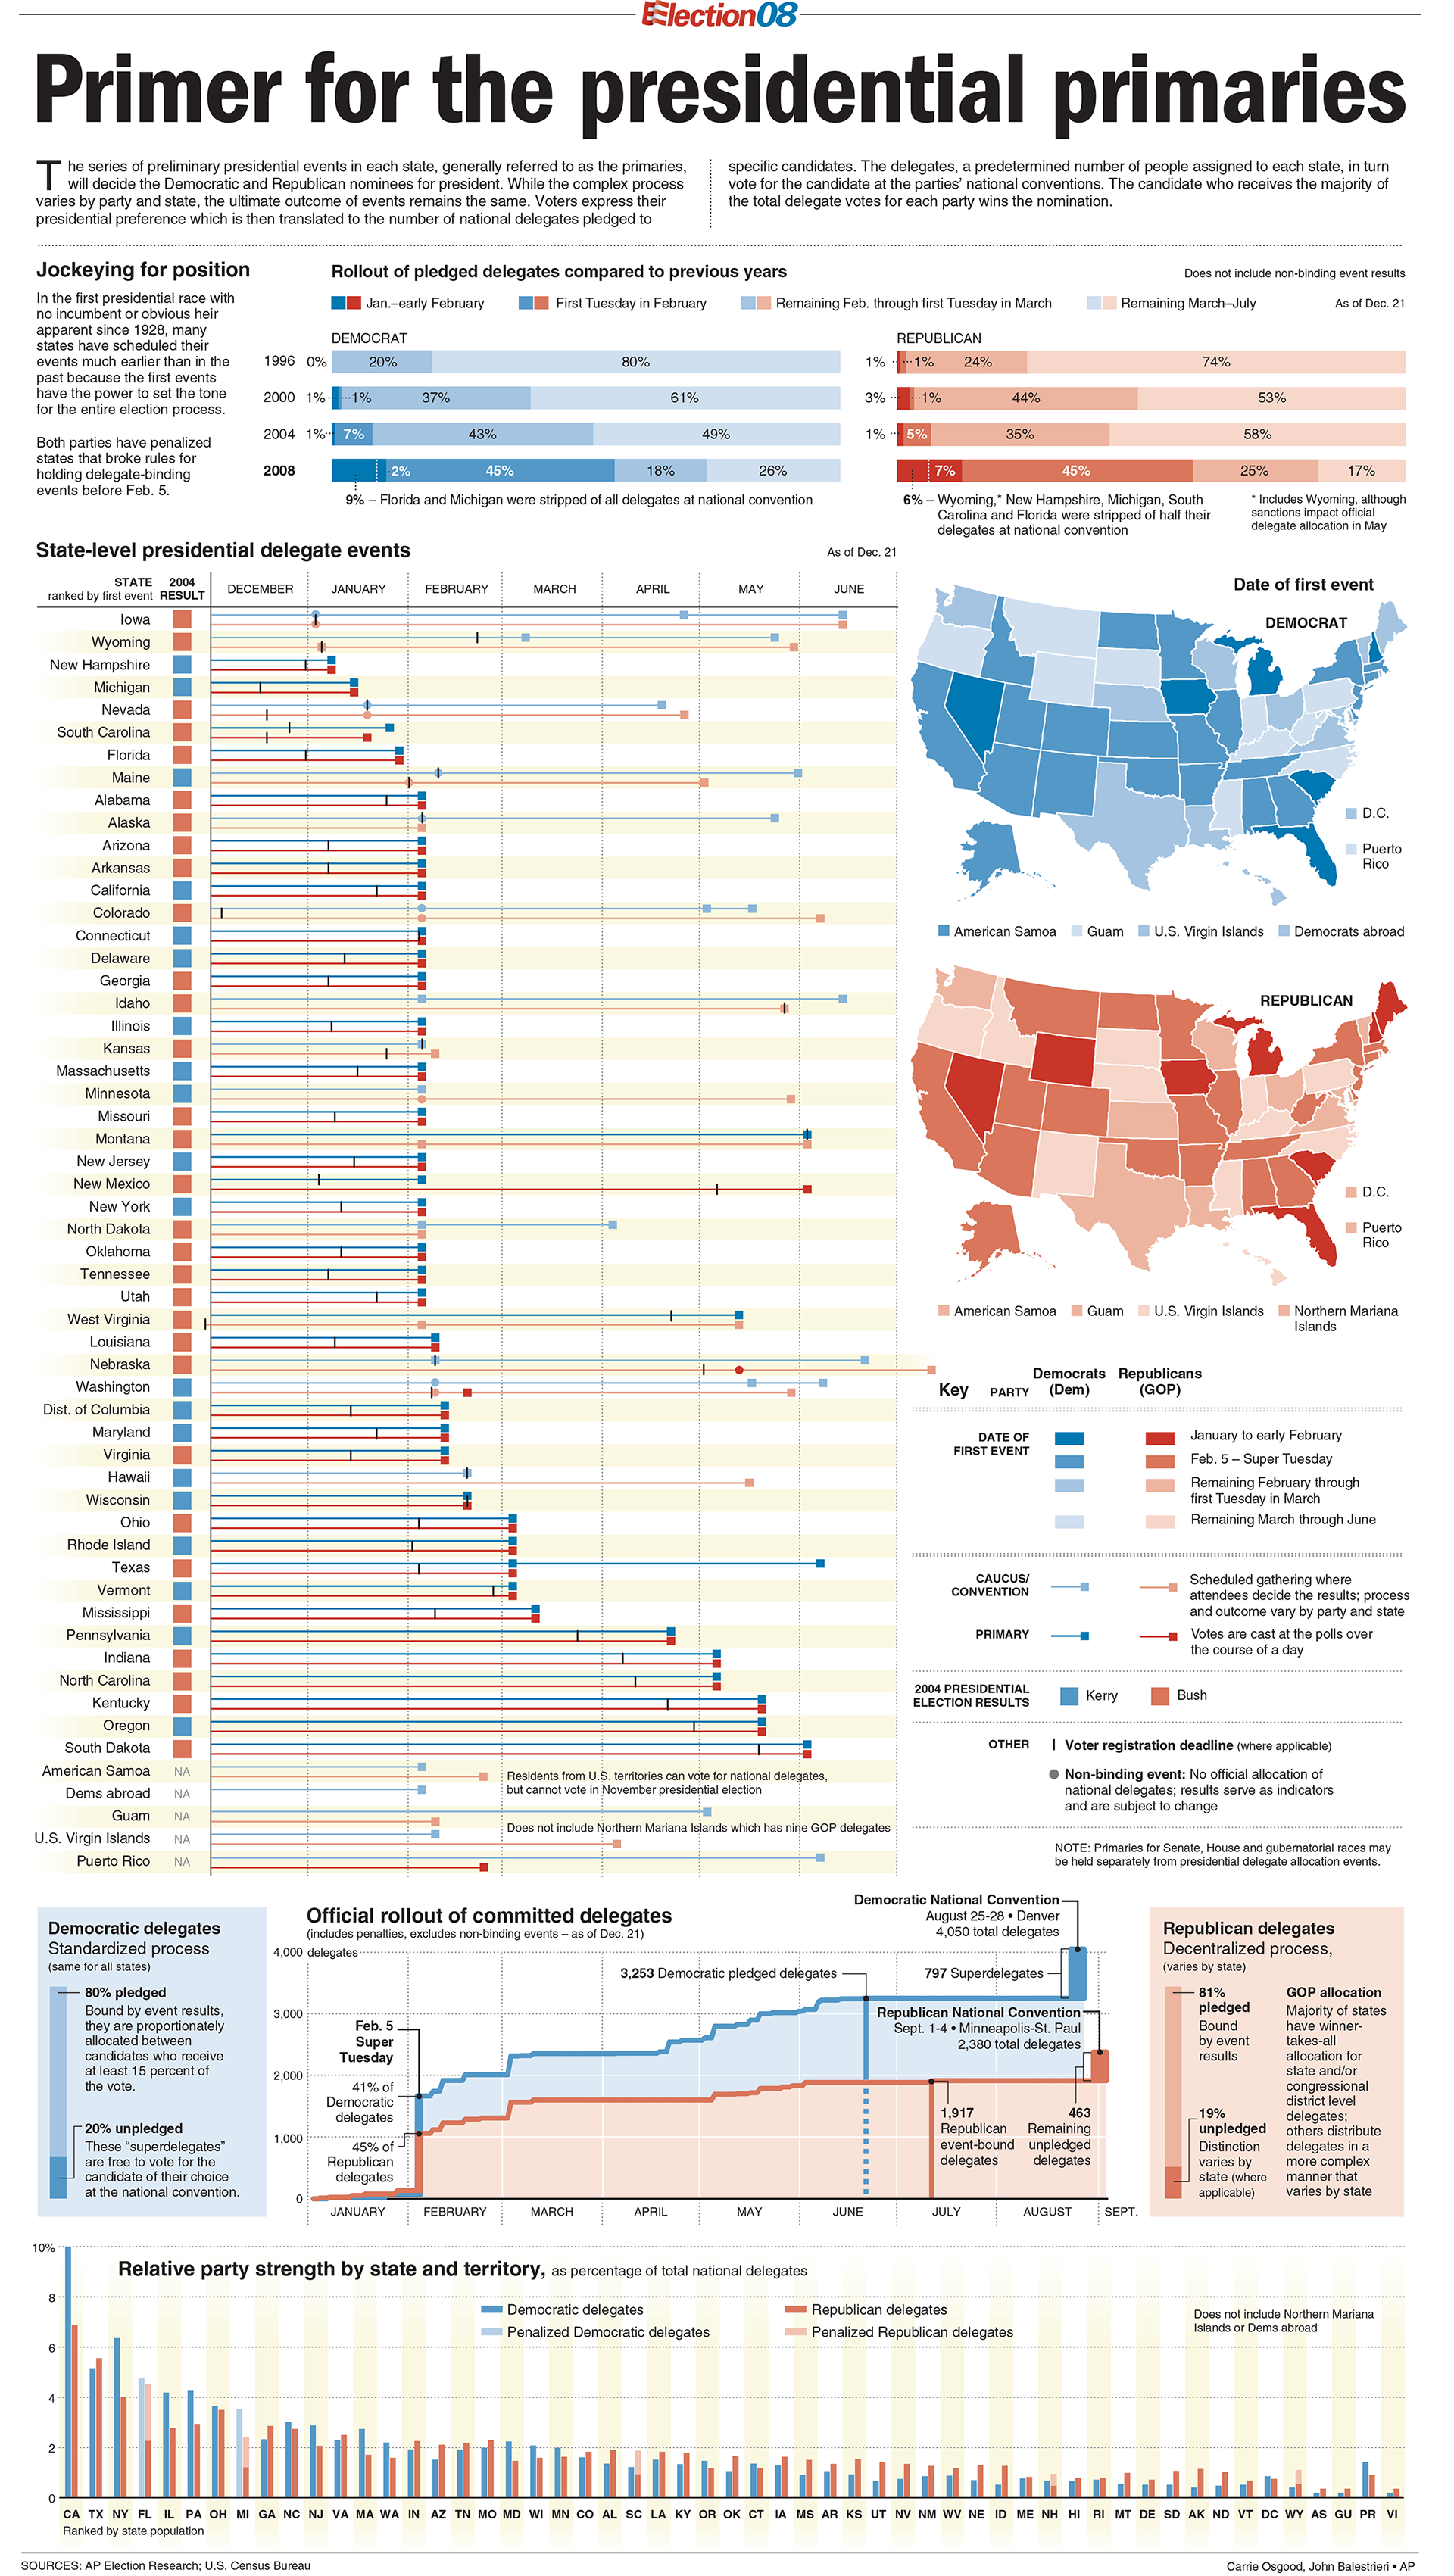
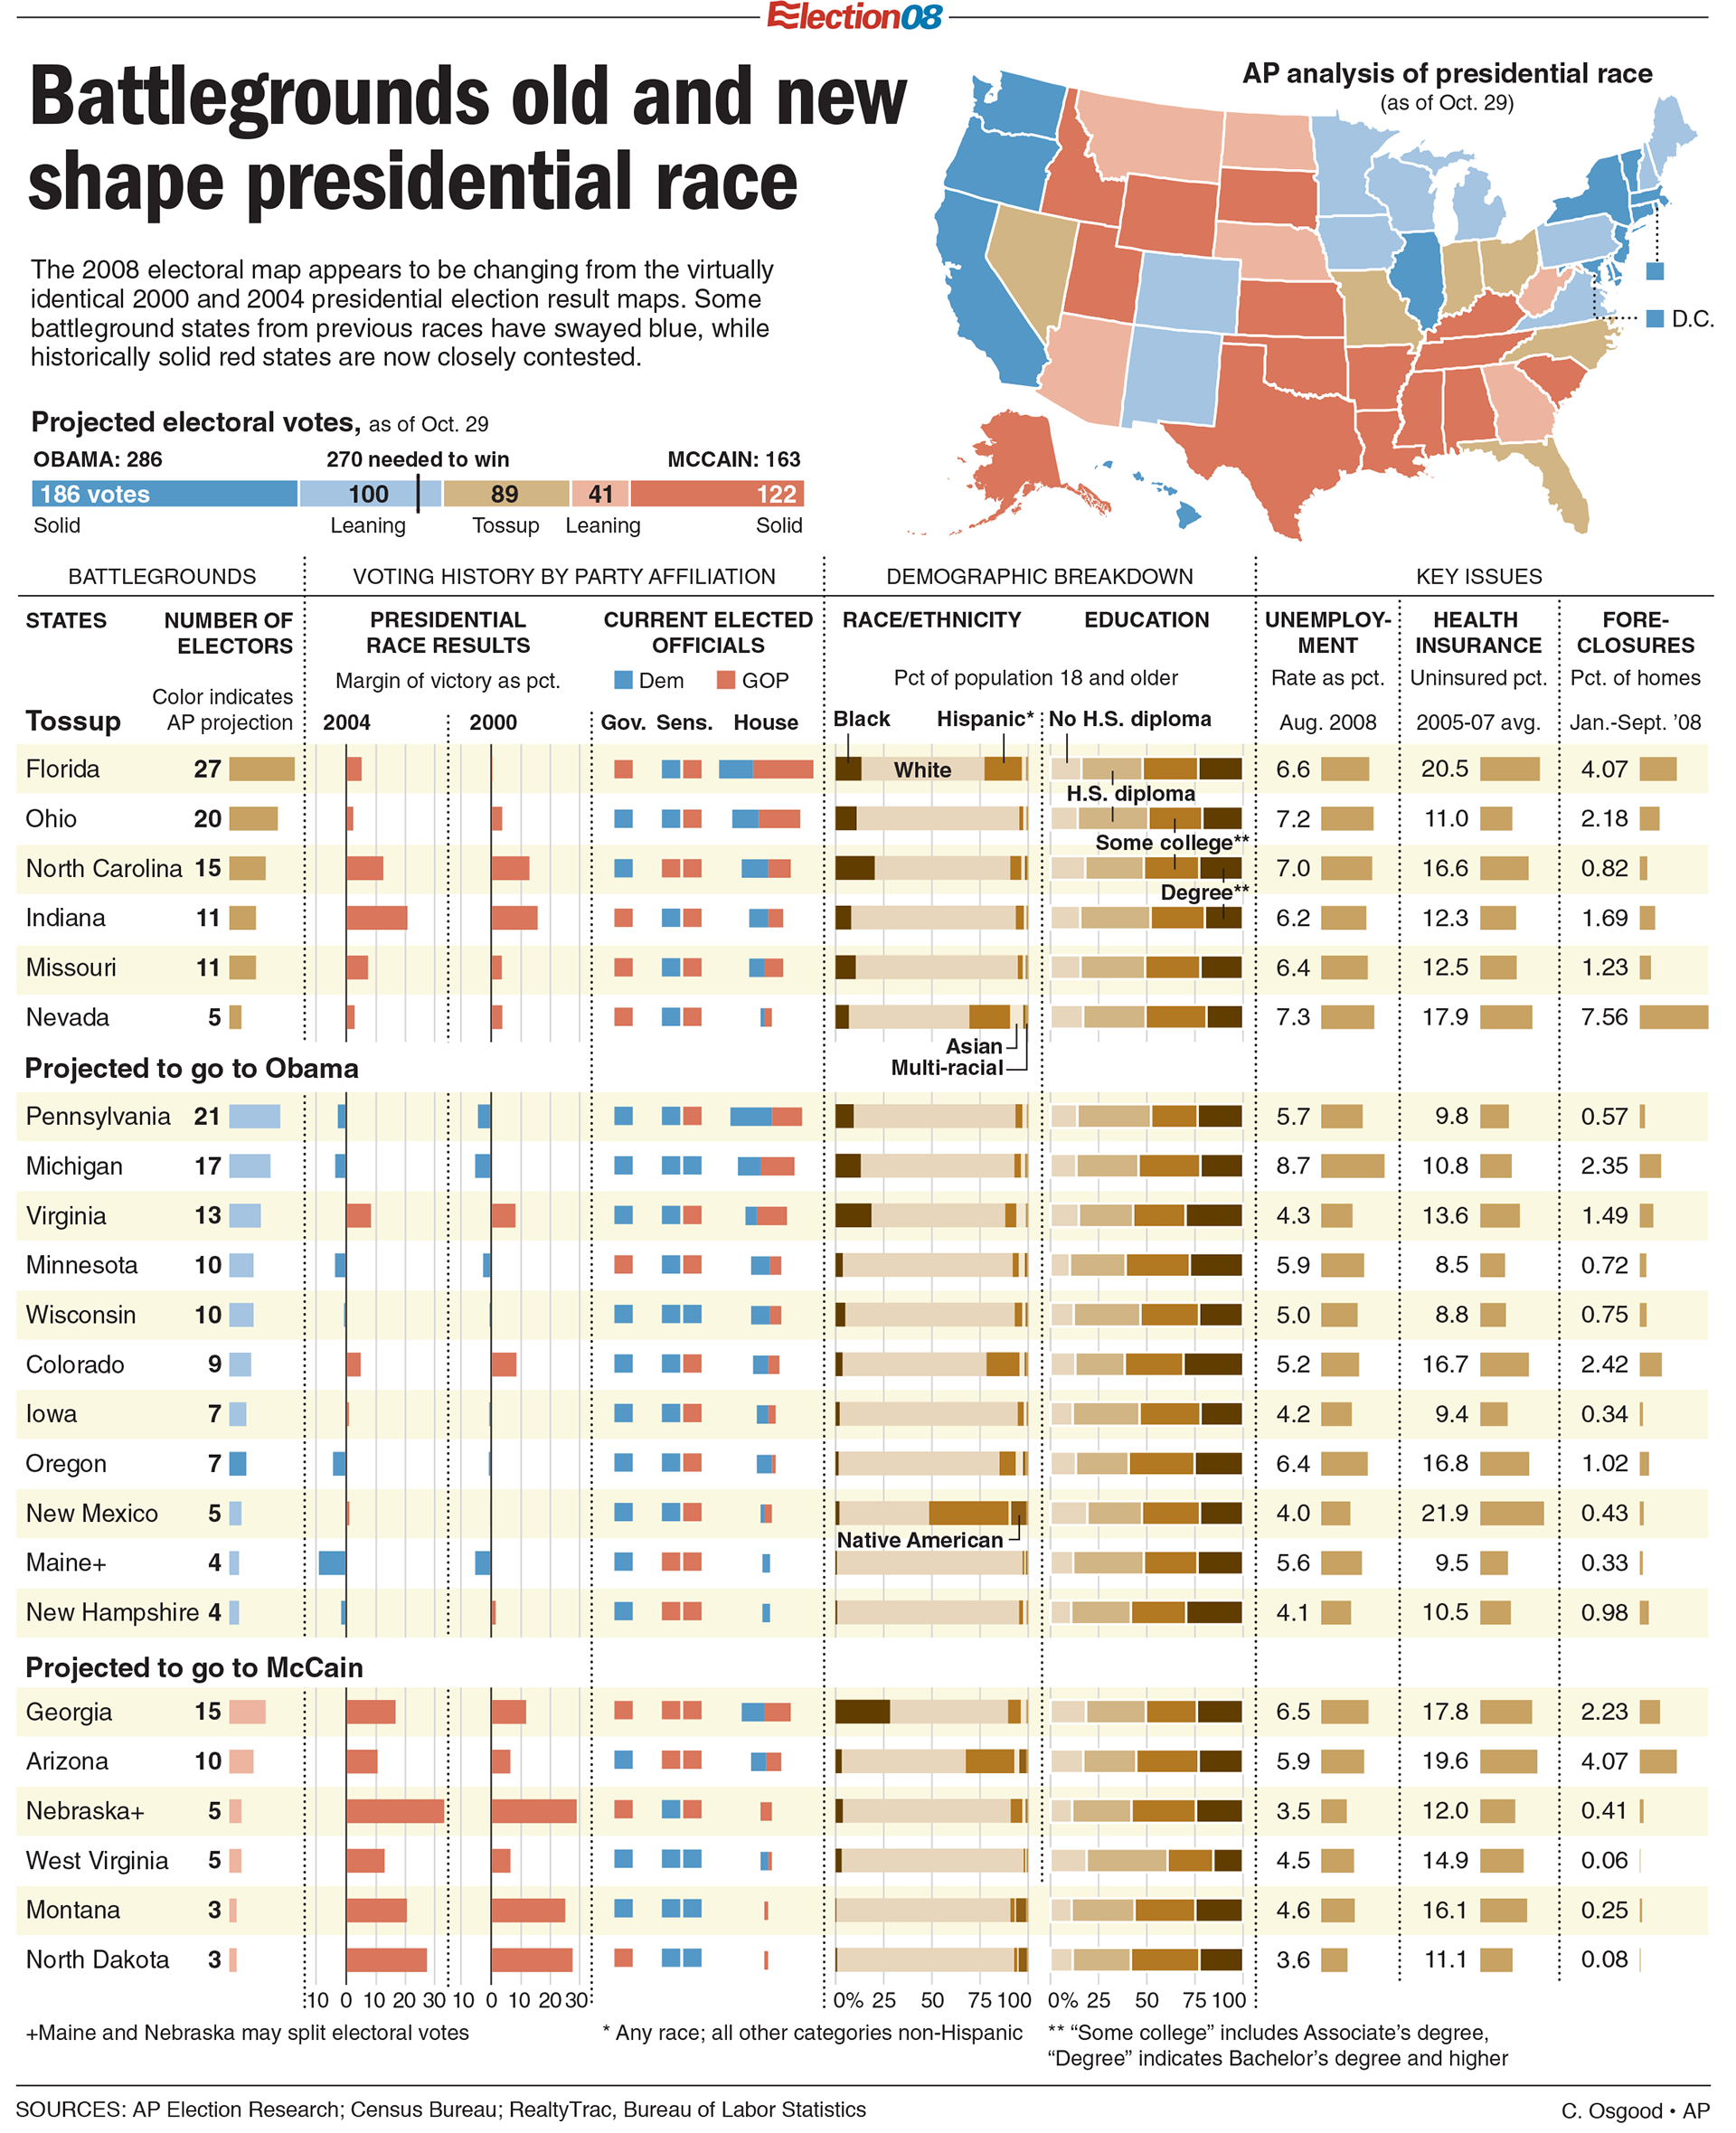
Presidential Primaries ›› | General Election ››
Presidential Primaries ›› | General Election ››